Saturday 31 October 2020

When is a single-cycle waveform not a single-cycle waveform? - [Single Cycle 3]

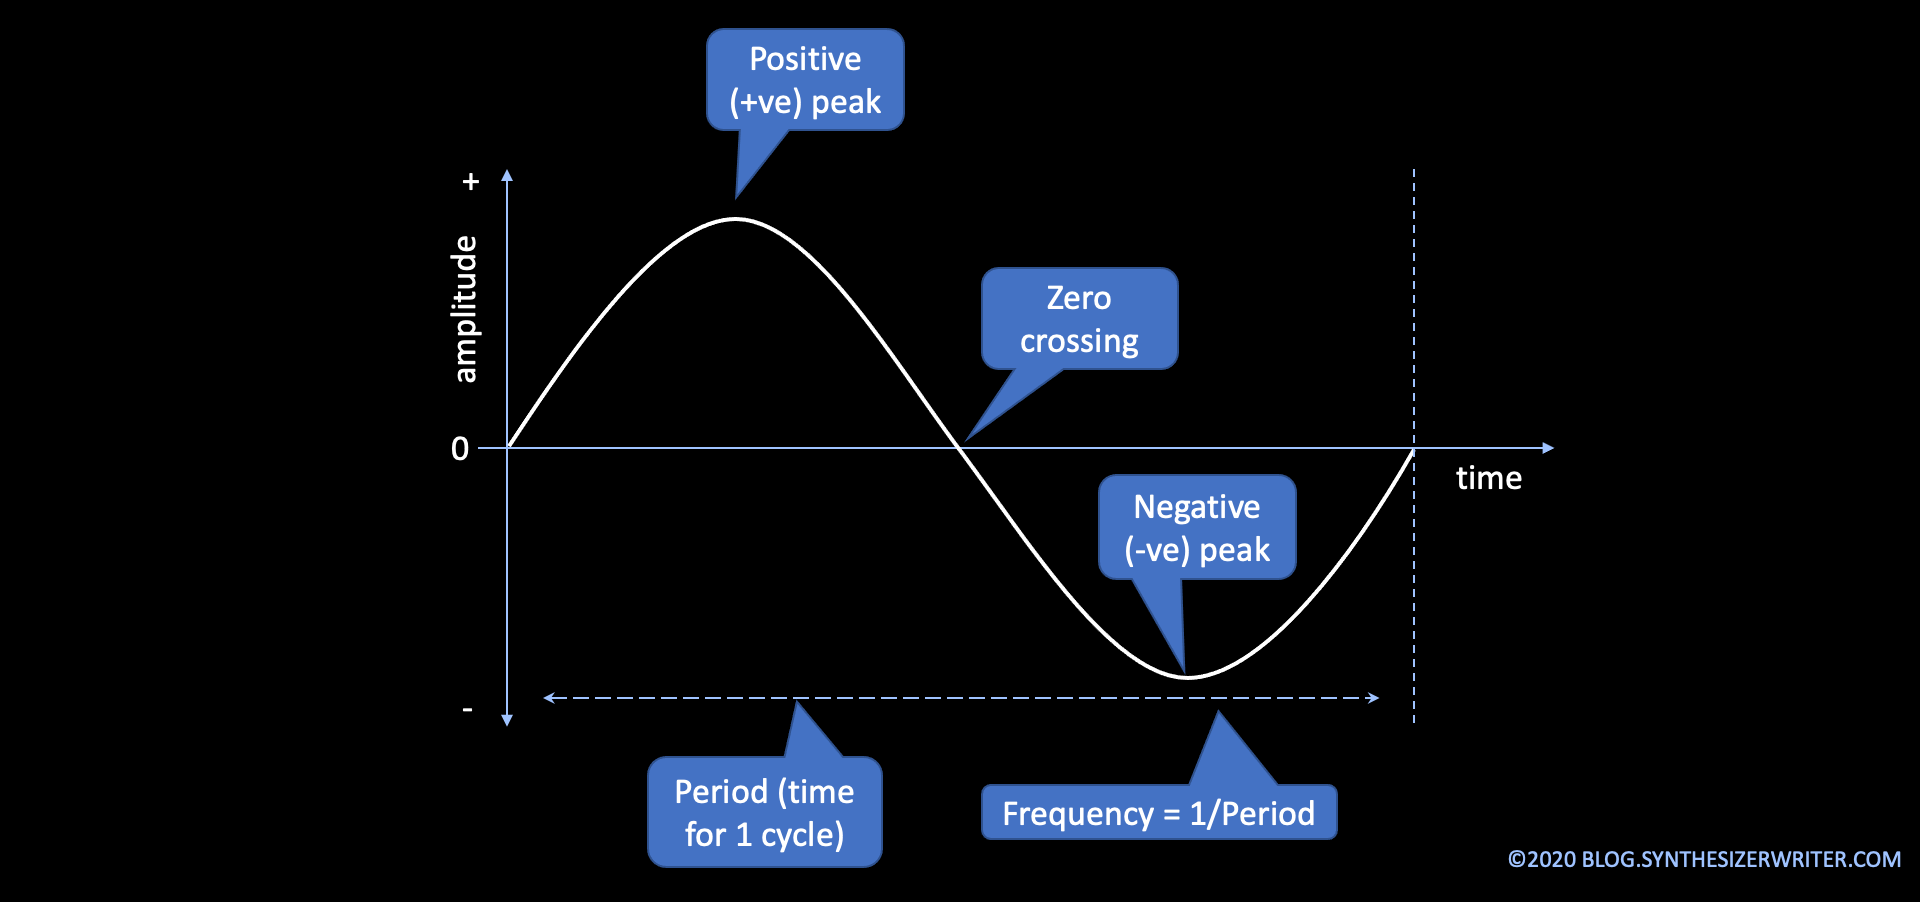
The first part of this series of posts was about waveforms - and the 30dB rule applies to both analogue or digital waveforms (although a high resolution LCD might get you to 40dB!). The second part was the same - all of the terminology applies to any way of storing the waveform. This part looks at digital storage of single cycle waveforms. 

[As an aside: There have been several synthesizers with analogue oscillators that provided 'waveform drawing' controls (and I designed and built one of my own many decades ago), but they tend to use very small numbers of points to represent the waveform. I have always had a design rule of not having more than 8 sliders in a group on a synthesizer - and in fact, the 'rule of 5' probably over-rides that. (Once you get beyond five user controls closely packed together, then people find it harder and harder to locate a specific control... Take a look at modern synth UI designs, and you will see 'Rule of 5' everywhere...) So 16 (or more) sliders is cumbersome, expensive, slow to adjust, suffers badly from 'The 30dB Rule', and isn't enough points to get good waveforms when compared to a single rotary 'preset waveform' selection switch! (It also looks too much like a third octave graphic equaliser!) In these days where 'vintage' and 'analogue' seem to have huge customer appeal, then I wouldn't be at all surprised to see a synth with lots of sliders to set a waveform, maybe doubling up as additive synthesis controls.]

WAVs

One of the common ways to use digital single cycle waveforms is via .WAV files. WAVs are tagged file format files that are used to store and exchange digital audio, and are examples of a RIFF file (Resource Interchange File Format) which was defined by IBM and Microsoft (and is the native audio file format in Microsoft Windows (and is actually closely related to the AIFF files that you find on Apple products as well...) WAV is actually shorthand for Waveform Audio File Format, which ought to mean that it should be WAFF (I can't help imagining an alternative universe where table tennis is colloquially called Wiff-Waff instead of Ping-Pong, and where WAAF files have nothing to do with the Women's Auxiliary Air Force from WW2...). There's plenty of detail on the WAV file format on Wikipedia (Disclosure: I'm a donator to Wikipedia.)

Aside from all this tech-talk, WAV files are in very widespread use for exchanging uncompressed audio between computers and sample players, grooveboxes, other computers, drum machines, etc. Note that although WAVs can contain compressed audio, you are much more likely to find compressed audio in a format that builds on MP3, like AAC, but it is quite rare to find any support for this in drum machines, grooveboxes etc. The 'higher-end' BWF multi-channel version is widely used in the broadcast and pro-audio industry, but again has limited support in drum machines, grooveboxes, etc. But at the opposite end of things, WAVs are very often used for storing and transferring single cycle waveforms, and support for WAVs is pretty close to obligatory in a groovebox, drum machine... As always, there's bound to be some exceptions so that people can look smart by saying: 'Ah, but'. 

A Google search for 'single cycle waveforms' will probably get you lots of references to the Adventure Kid web-site and the Elektron 'Elektronauts' forum site (both recommended for getting single cycle waveforms), plus many commercial offerings. As with various projects to create all possible MIDI melodies, various people have tried to exhaustively create all possible single cycle waveforms within specific limitations, although the copyright and other legal systems seem to not like any type of mechanistic/algorithmic brute-force approach that intends to try and acquire ownership of creative activities.   

The obvious...

As you might expect, the first single cycle waveforms you will find are probably going to be the 'classic' synthesizer waveforms: sine, triangle, square, sawtooth, and various pulse widths. I'm going to show them here for reference, complete with their harmonic content or spectra (spectrums, if you prefer), although, as the next blog post shows, just having the spectrum for a waveform may not be as useful as you might think. For now, I will just describe what the spectra shows about the basic harmonic content of the waveshape, and you will be forewarned that there is just a little bit more to it...

One of the first things that people tend to do with digital storage of audio is to turn classic analogue synthesizer waveforms into a digital form, so let's start there...

Sine

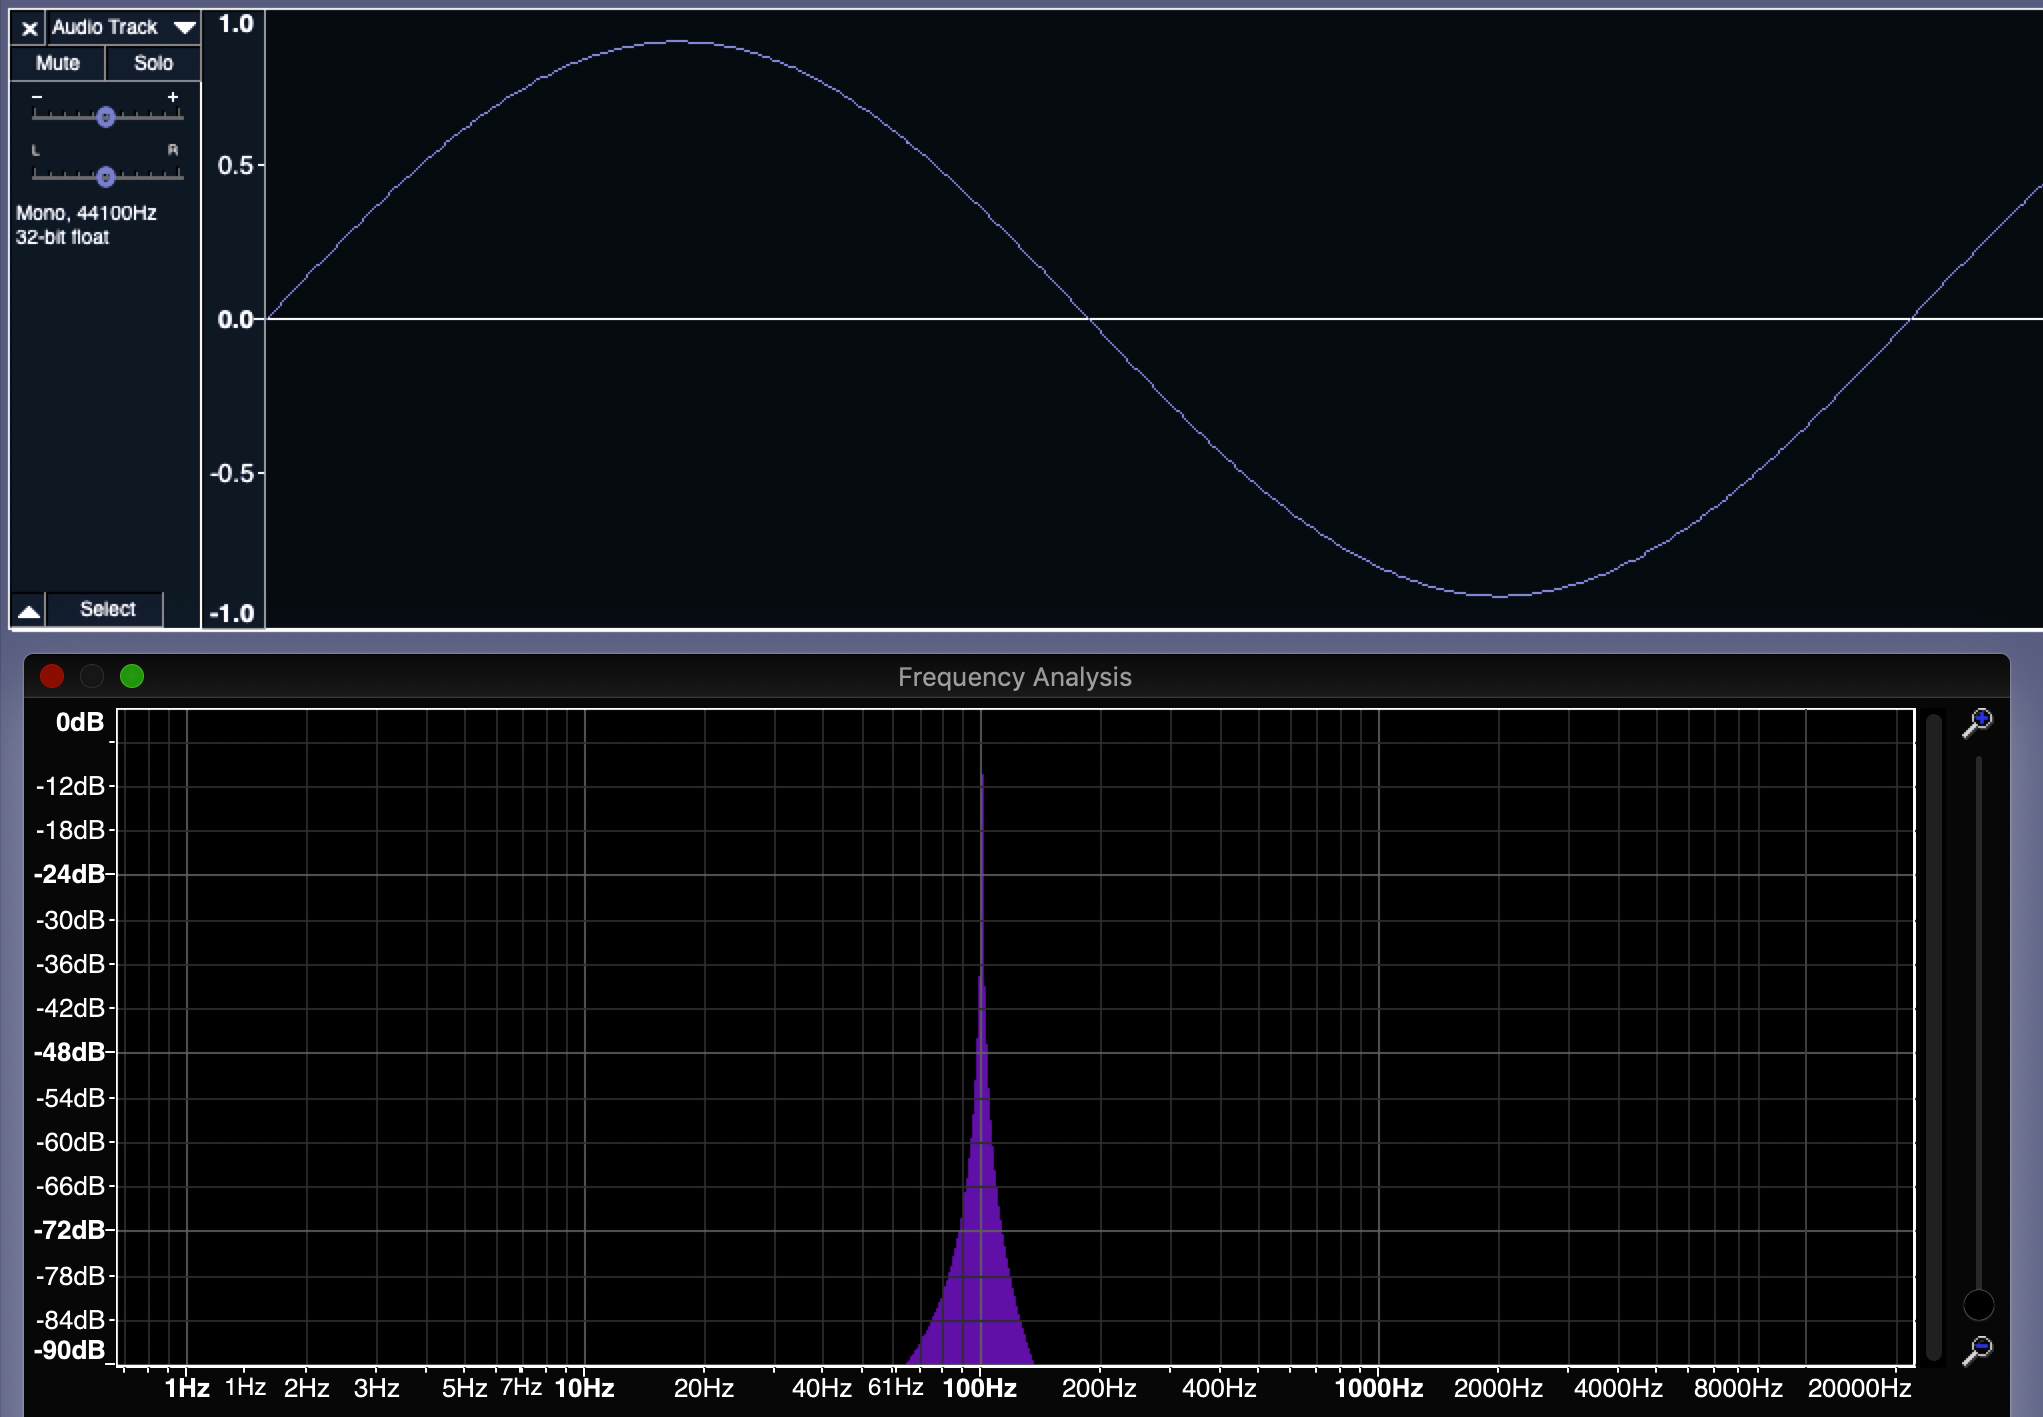
The sine is a beautifully smooth and curvy looking, simple and pure sounding waveform. It contains (it is!) just a single frequency (called the fundamental, and 100Hz in this example), and so has no harmonics in it. (multiples of the fundamental frequency) For LFOs, sine waves are very useful because they smoothly modulate, or pan, or filter, or... 

However, using only a few samples to represent the waveform isn't a good way to get the best fidelity. I have seen single cycle waveforms of sine waves that only have 37 samples. Which takes us neatly into why particular numbers of samples are used for single cycle waveforms.

There is a lot of variation in the numbers of samples that are used to represent a single cycle waveform. In Max (and MaxForLive), the ~cycle object originally defaulted to using 512 samples of a single cycle of a cosine wave. But it wasn't fixed - you could replace the default waveform by using any other set of 512 samples, or you could change the number of samples: more recent versions of Max use 16,000 64-bit samples. A lot of the single cycle waveforms that you find on the InterWeb are 337 samples long, whilst others have 256, 1024, 2048 or 4096. 

You may be confused by these numbers, but remember that these are not sample rates: like 44.1kHz, 48kHz, or 96kHz. These big numbers are the rate at which samples are taken. If a mono audio signal is recorded for 1 second at 44.1kHz, then there will be 44,100 samples that represent that one second of audio. One Hertz is one cycle per second, and so if that one second contained a 1Hz sine wave, then there would be 44,100 samples being used to represent that sine wave. 10Hz would be 10 cycles in one second, and so a single cycle of a 10Hz sine wave would only require 4,410 samples. 100Hz would be 441 samples, which is pretty close to the 512 that Max used to have as the default. However, 1,000Hz would require 44.1 samples, which is tricky. It is a small number (just above 37!), and it isn't a whole number of samples... What does 0.1 of a sample look like, or is it just impossible?

Rather than get involved in strange philosophical questions about fractions of samples, it is easier to arrange things so that a single cycle waveform is exactly the right frequency to fill a given number of samples with one complete cycle. No more. No less. In the case of the 100Hz sine wave, sampled at 44.1kHz, we now know that 441 samples is exactly the right length. (Or we could say that 441 samples will hold a single cycle of a 100Hz sine wave when the sampling rate is 44.1kHz.) Unfortunately, 441 isn't 512, or 337, or 4096, or 16,000! 

What we need to do is turn this round, so that we can work out the frequency of the waveform that will fill a given number of samples for a specific sample rate (like 44.1kHz!). If we take 512 as an example, then the frequency of a single cycle that will fill 512 samples is 86.1328125. Now frequencies that are not whole numbers are fine - so we avoid any problems with 0.1 of a sample! But how did we work that out? 

If you divide the sample rate (44,100) by the number of samples (512) that you want to use in your single cycle waveform, and you get exactly 86.1328125. But it is actually easier to understand what is happening here by turning the equation over. In other words, what does 512 divided by 44,100 represent? Well, the number of samples divided by rate that samples are being taken is going to give us what fraction 512 is of 44,100. It turns out that this is 0.01158371. So 512 is just over one hundredth part of 44,100. In fact, if you think about it, then 441 would be exactly one hundredth of 44,100. So what does the fraction represent? It is samples (512) over the sample rate (44,100) and so it is just 1/rate. And to get to the rate (which is the frequency) then all we need to do is find the value of 1 divided by the fraction. 1/0.01158371 is 86.1328125, which is the rate that we need to use to fill that fraction of 512/44,1000.   

So the formula is:

Frequency for a single cycle = Sample Rate / Number of samples for one cycle

Using this, we can now look at some of those common numbers of samples and see what frequency they give for a 44.1kHz sampling rate:


Table 1. Sample Rate, Number of Samples and Required Frequency.

At this point, many people look at the numbers, with all the digits after the decimal point, and just accept them. But it turns out that the 'Popular on the InterWeb' value, 337, gives a frequency which might be familiar... Maybe doubling it will help? 261.721068? 

What is the frequency of Middle C? 261.625565Hz. Aha! 337 is chosen because it is very close to Middle C, and so simplifies the transposition of oscillators using 337 sample waveforms (i.e., you don't need to transpose them!). It turns out that a lot of the single cycle waveforms that you find on the internet have a frequency of one octave below Middle C. 

Triangle

This is kind of like a sine wave drawn by someone who prefers straight lines to curves. It contains only a few odd harmonics that are are quite low amplitudes - so with a fundamental at 172.265625Hz, the 3x  harmonic is at -25dB, and is at 516.796875Hz. What is fascinating about generating and analysing real waveforms instead of the ones that you find in text-books is that they can be very different because of all sorts of imperfections in the generation, capture and analysis processes. 600 samples is not going to give perfect results for a start...

I'm not really a triangle waveform fan. Triangle waves are not very useful because a little bit of low-pass filtering reveals the sine wave at their core, and opening up the low pass filter only adds a little bit of extra harmonic content. For LFOs, triangle waves spend almost all their time linearly going up or down, but then suddenly (and very abruptly) change direction. So whereas a sine wave is all about smoothly getting to the point where it reverses direction, a triangle wave rather boringly goes straight to the point, immediately changes direction, and then goes straight towards the next reversal. A bit too jerky in many cases for me, and I often prefer the smooth almost asymptotic sine wave. (Asymptotic means that it never quite gets there...)
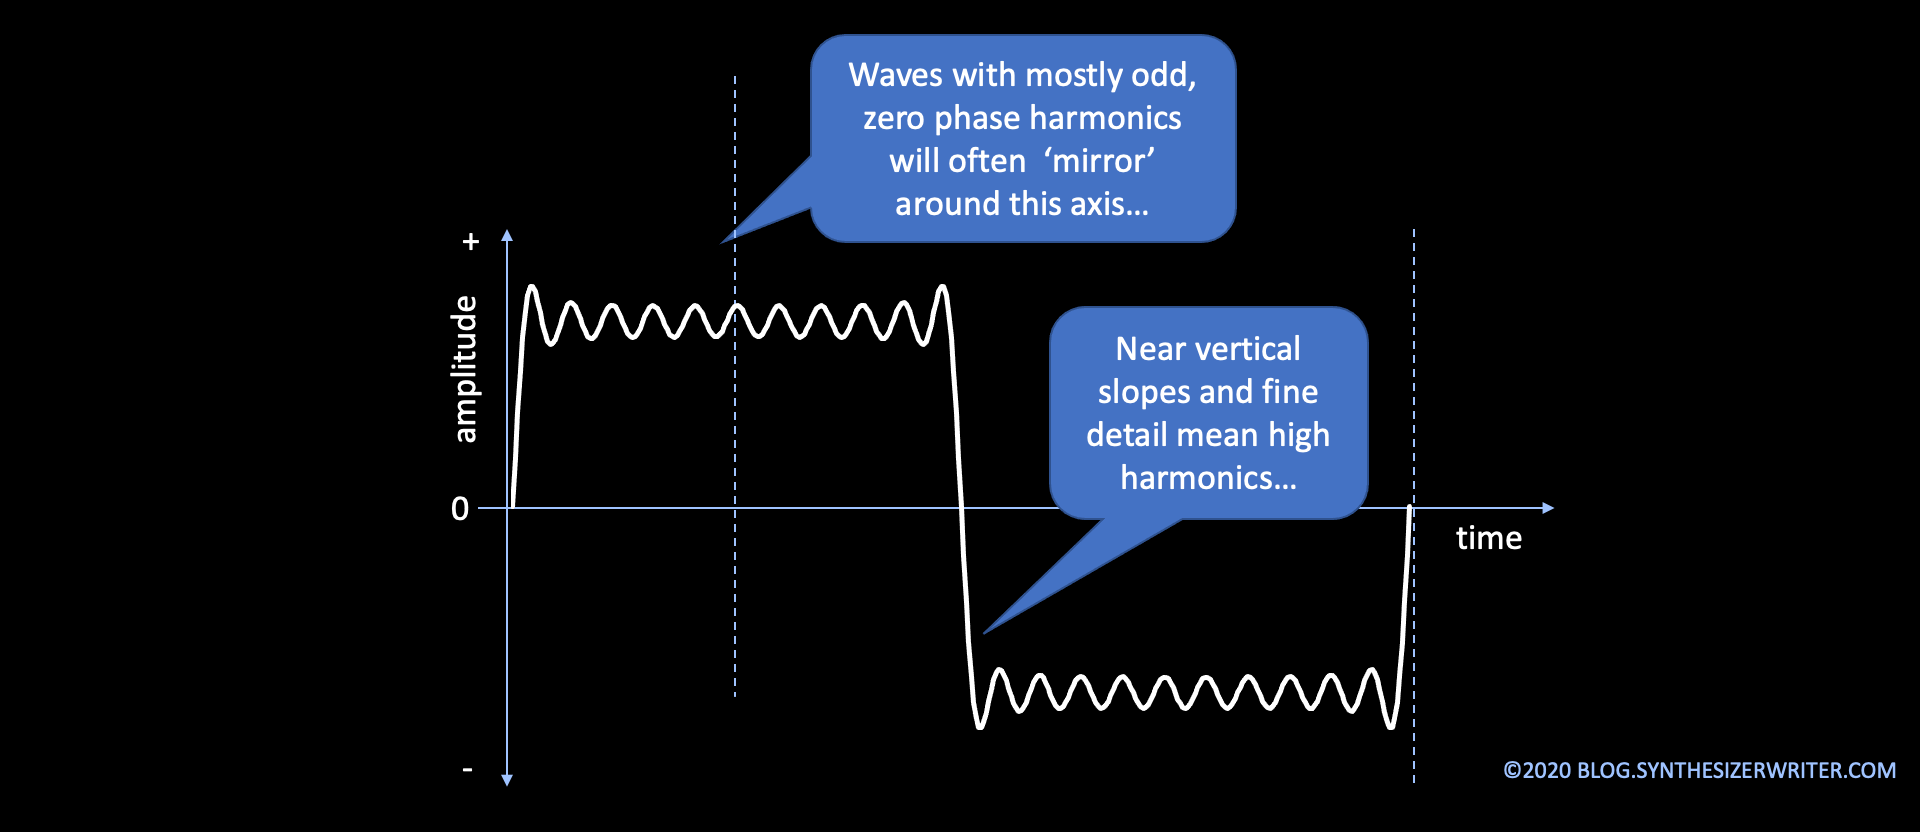
Square

The square wave, despite what the shape might suggest, is actually exactly the same harmonics as the triangle waveform, but with slightly higher amplitudes. As you can see, the 3x harmonic of the 73.5Hz fundamental, at 220.5Hz, is only at about -10dB, and then the 4x harmonic (which isn't odd, and shouldn't be there) is at 294Hz and is at about -15dB. For the full story, you are just going to have to see the next blog post... For LFOs, then the square couldn't be more different than the triangle or the sine wave - it stays at the same level for half the time, then suddenly jumps to the other level, and then stays there for the other half of the time, then jumps again.  
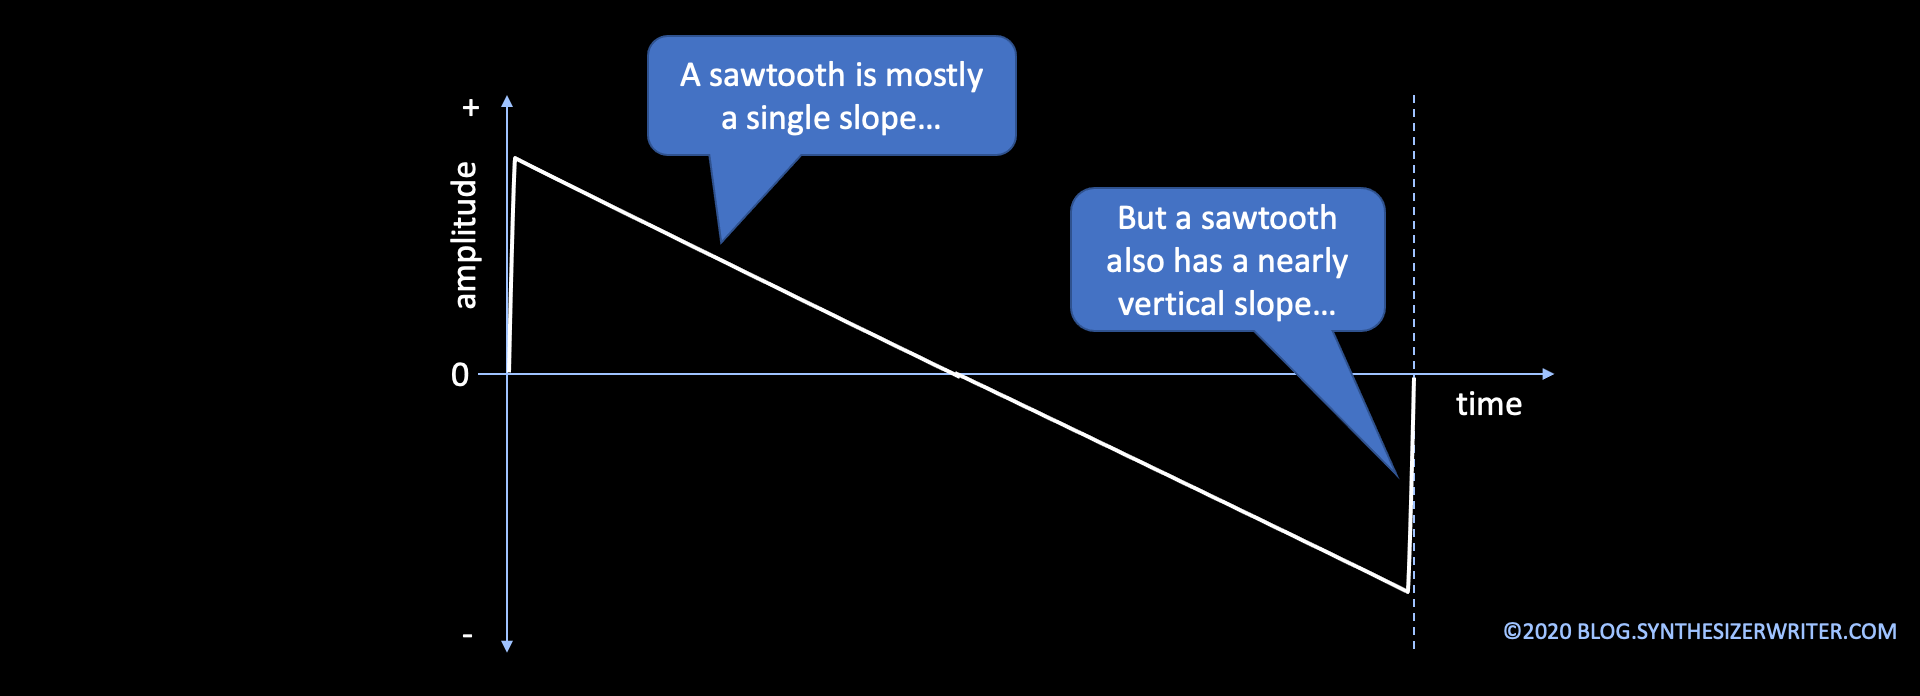
Sawtooth


There are two ways of showing a sawtooth. The one shown here starts at the gently sloped zero crossing and goes up, then suddenly plummets down, and then rises again. The other way starts with the zero crossing on the steep sloe, then has a single long upwards slope, finishing with the sudden downwards plunge. Unlike all of the waveforms so far, there are two different sawtooth waveforms: one where the gentle slope is upwards (a rising sawtooth, or a saw up) and another where the gentle slope is downwards (a falling sawtooth or a saw down). Showing the rising sawtooth like this kind of follows the other waveforms nicely. This time, the harmonics are the expected ones: odd and even harmonics gradually dropping off in amplitude. 

For LFOs, then the two sawtooth waveforms can have very different effects: a rising sawtooth used for pitch modulation gives rising frequencies, for example, whilst a falling sawtooth would give descending frequencies. On modulars, I have always been a fan of using a sawtooth and its inversion (if you invert a falling sawtooth it becomes a rising sawtooth (and vice-versa)!) for controlling things in opposite ways. 

At audio frequencies, then Up/Rising and Down/Falling sawtooth waveforms sound exactly the same, and they have the same harmonics at the same levels. 

If the sine wave is the ultimate in smoothness, and the square wave the ultimate in jerkiness, the sawtooth is pretty much the exact opposite of smooth - as a control and as a timbre.

Pulse

There are lots of pulse waveforms - anything that just jumps between the upper and lower limits that doesn't split the time 50:50 is, by definition, a pulse waveform. Some people say that a square wave is nothing more than a special case of a pulse. Many oscillators aren't very happy doing very short pulse widths, and so I won't be doing 1% or 99% waveforms here (again, like sawtooths, you have two opposite wave shapes, but not as good looking! And again, pulse waveforms with the same time split sound the same...).

Pulse waveforms are described in various ways: as ratios (1:1 is a square wave), as percentages (50% is a square wave) , and sometimes the ratio/percentage is called a duty cycle, which is an obscuring piece of jargon that seems to be used less and less.

First, something like a 22% pulse waveform:


The big blob on the left hand side is the DC offset, by the way. Pulse waveforms have them because they are not symmetrical around the zero axis. (The area under the positive part of the waveform is not the same as the area bounded by the negative part of the waveform - which is why the square waveform is 'special': it has no DC offset!) But the harmonics are high in amplitude: the fundamental at 73.5Hz is at -2dB, and the 2x harmonic is only at -6dB, and there are lots of other harmonics that are above the -40dB 'Rule' level, so they definitely will be visible on a waveform display!

In an LFO, then pulse waves are kind of like square wave, but the different time that is spent at the two levels is not to my taste. Once again, like sawtooths, there are two varieties of pulse: each the inverse of the other, and all just as boring. 

For a 10% pulse, then it is just more:


The DC offset is really big now! But look at how the harmonics are very high as well. Compare this with the triangle and square wave to see the differences. 

As was mentioned in part 2 of this series, the more jagged the waveform, the more high frequencies that will be present. A 10% pulse waveform is pretty jagged, in shape and in sound, and the spectrum contains lots of harmonics at high amplitudes. 

In an LFO, a 10% pulse waveform is boring for 90% of the time, then jumps to the other level for 10% of the time, and then is boring again. Not my favourite LFO control waveform. If a sine waveform can be described as being 'smooth' in sound and effect, and a sawtooth waveform is 'jerky', then a pulse waveform is 'boring - except for a very short amount of time'. There is an exception to this, and it is found in a lot of advanced modular setups: if you combine several LFOs with pulse waveforms, then you start to get a control which is good for random percussive or rhythmic sounds, sort of like digital LFO 'noise'. Curiously, having a 'noise-like' 'random-ish' 'difficult to predict' control like this often sounds more interesting that proper random noise, perhaps because human beings are preprogrammed to look for/listen for/find/feel patterns.  

Beyond the obvious...

There are more waveforms!

If you add a sawtooth and a square wave together, then you get a sort of droopy waveform. 


This is a strange waveform, so I have shown more than one cycle of it so that you get a better feel of what it looks like. The spectrum, as you might expect, has elements of the sawtooth and the square spectra. 

In an LFO, this is like a jerky rising or falling sawtooth. It doesn't have the inevitability of the inexorably rising (or falling) sawtooth, or the boring static levels of the square, but it does have the sudden jumps of both. I'm not sure that I've ever used this wave shape in an LFO...

Hyper! 

If you replace the linear slope of a sawtooth with a curve, then you get a hypersawtooth waveform, although this term is also sometimes used for several sawtooth oscillators summed together. 


Once again, I have shown several cycles so that you get a clearer view of the shape. It's a sawtooth where the linear slope is replaced with two curves - and the shape of those curves determines the fine detail of the spectrum. For the first time, the fundamental is not the highest frequency in the spectrum - the 2x harmonic is higher! What this means is that there are lots of high frequencies in a hypersawtooth, and so it sounds brighter than a sawtooth or a narrow pulse. 

In LFOs, the hypersaw shape is a bit like a sine with a wobble in the middle. I have not used it very much.

Transpositions...

Something else which is 'non obvious' is working out what the required transposition should be for those single cycle waveforms that aren't 337 samples long. This seems to give people problems, but all it requires is to convert the ratio of the two frequencies to semitones and cents. Here's a table that extends the previous one:

Table 1. Sample Rate, Number of Samples, Required Frequency, and Required Transposition.

So for a 256 sample single cycle waveform, you just transpose it down by 4 semitones and 77 cents.

From the classics...

One type of single cycle waveform that you probably find are based on the shapes of 'classic' analogue synthesizers - not the mathematically perfect waveforms that you find in text-books. The '30dB Rule' probably applies here, plus there is also the assumption that vintage analogue synths repeat exactly the same waveform every cycle. Then there is the problem that a lot of the character and 'sound' of many synthesizers is dynamic: the way that filters distort, or the way that filters go into self-oscillation, DC offsets affecting clipping in output stages, or the way that the oscillator sound bleeds between oscillators, and lots more. Timbre is more than just a static sound, it is how the sound changes over time and under the influence of performance controls like the Pitch Bend Wheel, the Mod Wheel, After-touch, etc., as well as the interactions between various parts of the device itself (beehive noise, for example), and trying to capture this in a single cycle waveform is not always easy. 

You may well find some 'single cycle waveforms from classic synths' that you like, but don't forget to add a bit of noise into the audio, into the filter cut-off and resonance, detune the oscillators, add a bit of chorus and basically 'productionise' it as if it was a real old synth that costs a fortune to maintain and which spends part of each year being serviced. Who knows, you might find that the contribution from the single cycle waveform is not as important as some of the other post-processing...

Not what you expected!

One of the fascinating things about single cycle waveforms is when they catch you out. One standard example is creating a single cycle waveform using noise, so that you get a 'random' wave shape. A lot of people expect that this will create white noise, and are disappointed when they get a buzzy tone. Unfortunately, because each cycle of the waveform derived from random noise repeats every cycle, you get a tone instead of noise. Depending on the source of the noise and how it is captured, then there may well be lots of high frequencies - In general, the more jagged the waveform, the more high frequencies that are produced. So single cycle waveforms made from noise almost always end up giving very thin, bright, nasal, buzzy results. 

In contrast, two programming techniques that can produce excellent results from singe cycle waveforms are Oscillator Sync and FM. The sound of sawtooth wave or square wave sync is very well-known, but if you use two different, unusual single cycle waveforms instead, then you can get some more unusual and distinctive timbres. For FM, then avoid the obvious sine waves, and explore shapes like triangle waves, or sawtooths or filtered noise waveforms (yep, you just knew that those noise waveforms had to be useful somewhere!). FM has an interesting reputation (and there are lots of YouTube videos that try to put you more at ease), and who knows, you may stumble into some of the less-explored backwaters of Chowning's wobbly oceans and find some gems.

No room for innovation...  

So is there any space left for new or novel or unusual singe cycle waveforms? I'm going to share some of my own attempts to be different. Some of them are not very special, but I'm hoping that some of them might be useful to you.

Sine and Square...

The first 'off the wall' approach is to mix waveforms that normally don't go together.  How about a cycle of sine wave followed by a cycle of square wave? Technically, this is a multi cycle waveform, but most oscillators don't care, and you will find that you have a lower frequency in the resulting sound because the square wave is effectively only present half the time, and so you get something a bit like a weird sub oscillator, plus something that isn't a sine or a square. Once again I have included a little bit more after the end of the cycle, so that you can see the repeat - yes, the 'single cycle' is the sine wave cycle plus the square wave cycle!

The spectrum tells us a lot about what this is going to sound like, there's a slightly lower fundamental and a big 2x harmonic frequency, and then strong clusters of higher frequencies. Despite being just two cycles of very simple wave shapes, this is a very strident timbre - more square wave than sine!

Si(ne)+(squ)are...


Going even further 'off the wall', if you splice half a sine wave with half a square wave, then that gives a different result. There's a bit more square to this one, and slightly less high frequency 'stuff', but it sounds unusual. There's also lots of DC offset because of the asymmetry in the wave shape.

Gapped sines...

Replacing the square wave cycle with nothing gives a result which sounds nothing like the fragments of sine waves that makes up all of it (plus the nothing!). There are two and a half cycles shown in the example, above: each 'single cycle' is just the sine wave plus a cycle's worth of nothing. The missing sine wave cycles add a lot of harmonics. So is this a single cycle wave, or a three cycle multi cycle with some gaps? The spectrum suggests that it is lots more jagged than it appears...so all of those discontinuities as the sine goes flat obviously mean lots of high frequencies, but we aren't used to discontinuities that hide on the zero axis...

Resonant... 2 cycles in one...


8 cycles in one...


16 cycles in one...


A different approach is to take several cycles of a waveform, and then to give that a very short envelope. In the examples shown, I start with the full size waveform and taper it down to almost zero. This gives sounds which have an intriguing 'resonant' nature to them, and don't forget to try them with sync and FM as well.

When you first see these waveforms, they look like multi cycle waveforms, but the repetition is of the whole of the waveform you see, from the big wave at the start, to the small wave at the end, so it is a single cycle, but it contains multiple cycles.

Chirps


Chirps change the frequency of the cycles within a multi-cycle waveform, and can produce timbres which sound very complex and which can't possibly be coming from a single oscillator playing a tiny fragment of audio (but they are!). In the example above then the frequency doubles over the single cycle. I didn't tweak the ends and so there's a discontinuity when the next cycle starts. This sharp feature in the waveform causes lots of high frequencies, and so this sounds more like a pulse wave than a (mostly) smooth sine-ish waveform. 

I know that using multi-cycle waveforms is seen as cheating by some people, and you can find that some oscillators don't have quite the range that they normally do when you need to transpose them a lot (the 16 cycle enveloped 'resonant' waveforms, for example). But I prefer to think of them as single cycle waveforms with unusual frequency content. 

One problem which you will encounter very quickly with chirps and some other multi cycle waveforms is tuning. if you thought that tuning FM on analogue subtractive synthesizers was difficult, then the wilder multi cycle waveforms can be even trickier to tune sometimes. I use a guitar tuner pedal to help me tune the oscillator transpose, and the flashing multi-coloured very bright LEDs intended to help guitarists can prove to be a very mysterious distraction to spectators. I'm not sure that there's always enough 'danger' and living on the edge' in many DAWless performances. Pressing buttons on little black boxes isn't very good to watch, but a few guitar tuner pedals can give just a hint of the edgy feel that Keith Emerson used to get with his Moog Modular on stage, or the rotating piano, or...  

But how do you make them?

All of this messing about with multi cycle waveforms might have you wondering what esoteric and specialist software tools I use to create them. It isn't actually that unusual - my main tool is Audacity 2.4.2. 


Yes, the free, open source audio editor software that you get free (or they get you to download it) with many domestic 'Transfer your old vinyl albums to MP3s!' devices. Audacity is much better than this use case suggests, and is actually very good zoomed in until you can see the individual samples:


All of the waveforms that you see in this blog post were created using Audacity, and without any fancy plug-ins (although I have written a few plug-ins in Nyquist, which is an 'interesting' programming language!). 

Where is the 'End'?

The display of digital samples (from Audacity) shown above has a circle at the top of a vertical line - often called a 'ball and stick' symbol. If you want to exercise your brain then you might like to consider what I said in part 2 about the start and end of a waveform being at the same level....


Let's start by looking at a sampled square wave with only16 samples per cycle. I've shown it as starting with a sample at time zero - the first sample. The last sample of the cycle happens just before the end of the cycle (and the end of the waveform) and is highlighted in light blue. The next sample is the first sample of the next cycle, and is highlighted in orange. The red line highlights the final part of the cycle between the last sample and the first sample of the next cycle. 

I would say that the last sample is not at the 'end' of the cycle - it is definitely earlier in time than the 'end' because there is a red line showing the time between the last sample and the start of the next cycle - and the red line is needed to make the period correct (the time between the start and the end). The 'end' of the cycle, for me, is just before the start of the next cycle - which I would say is at the right hand end of the red line. So, for me, the end of the cycle is not the last sample (the blue one), but a tiny bit of time before the first sample of the next cycle - the orange one. And what is the level immediately before the orange sample? Well, it has to to very close to the level of the orange sample. doesn't it? This is what I mean when I say that a waveform begins and ends at the same level. And yes, I'm kind of splitting the first sample into two pieces and saying that it is the start and vanishingly close to the end. 

Suppose it was suggested that the zero axis is obviously the start and the end level? (Since the average of the high and low samples is zero) Well, then, the first sample would not be at the start, but would be slightly later. So now the start and the end are somewhere in between the first and last sample - and if you think about it, then the level of 'somewhere between the first and last sample' has to be the same if the start and the end are infinitely close together. So even though the first and last samples are different, the waveform has the same level at the start and the end.

Luckily, you don't need to think about the start or ends of samples in this depth very often! 

Audacity 'Single Cycle' Tip Number 1

Audacity makes it very quick and easy to do some tasks that often defeat people - like changing the number of samples in a single cycle waveform. Here's how to do that:


First, select your single cycle in a track. Then go to the 'Effect' drop-down menu. Select 'Change Speed'. (Not any of the other Change options like Pitch or Tempo...). 


Then go to the 'New Length' field and type in the number of samples. Don't type in any of the time formats!

Audacity 'Single Cycle' Tip Number 2

Generating single cycles on wave shapes isn't completely obvious. Here's what you do: Go to the 'Generate' drop-down menu and choose 'Tone'. Enter the frequency (as in table1 above) and the number of samples you want, and press 'OK'


The key to entering samples and not times into those fields is the tiny arrow on the right hand side of the 'Duration' field. When you click on it, you get a drop-down menu that lets you select 'Samples'. This works in the 'Change Speed' dialogue box as well.


Examples

You can download .WAV files of many of the single cycle waveforms in this blog, plus a few more from here. [Not all waveforms are available in every format. I'm not good enough at batching! Think of it as a challenge to find the missing ones and recreate them in the correct format yourself...]

The waveforms were all produced at 44.1 kHz in two sample sizes: 256 and 600, and in three formats: 16 bit, 24 bit and 32 bit float. The user manual for your synthesizer, sampler or drum machine should tell you what format your oscillators prefer. 

Next!

In part 4 I will go more into how important spectrums are...

Links

the WAV file format on Wikipedia

Audacity

---

If you find my writing helpful, informative or entertaining, then please consider visiting this link:


Synthesizerwriter's StoreSynthesizerwriter's Store
 (New 'Modular thinking' designs now available!)


Tuesday 27 October 2020

A Deeper Look at Single Cycle Waveforms - [Single Cycle part 2]

The revisit to 'The 30dB Rule' got me thinking. I realised that there is a lot that most sources don't tell you about waveform displays. Now, if this was a YouTube video, I would be using an eye-catching picture and a bold primary colour headline like:

'Hidden waveform secrets!'

But this is a blog, and I'm not a great fan of the hyper-sensationalism that YouTube seems to encourage. Instead, I've decided to extend 'The 30 dB Rule Revisited' into a few parts, so that I can cover the topic in more detail. (and in even more detail in the next edition (4th) of my 'Sound Synthesis & Sampling' book) 

The Waveform

Let's start with the sort of diagram that normally appears in textbooks (or on Pianobook videos!) and build from that.

This diagram shows a single cycle of a sine wave: a 'sine' waveform. The time axis is horizontal, and the amplitude (posh word for volume, size, voltage...) is on the vertical axis. The convention is that you show the positive part first, starting with the first time that the waveform crosses the zero axis, and then the negative part, finishing with the third and final zero crossing. This is just a convention! You could start anywhere on the waveform if you wanted - the waveform doesn't care. But you do need to show at least one cycle, of course. 

I normally try to avoid too much maths in this blog, but there's an important formula in the diagram: the relationship between Frequency and the time it takes to complete one whole cycle (this time is called the period, which harks back to pendulums and clocks and physics...). The formula is:

Frequency  = 1/Period

Which can be clarified as:

Frequency (in Hertz) = 1/Time to complete One Cycle of the waveform (in ms)

For most audio signals (posh word for sounds, audio voltages...) then the time is usually conveniently measured in milliseconds (thousandths of a second) or microseconds (millionths of a second). Seconds are too big a unit of measurement for the short time that it takes for a sine wave to wobble. For example, a 50Hz mains electricity (in some countries) takes 0.02 seconds to complete one cycle, but it feels much easier to say 20 milliseconds (200ms). In countries where the mains frequency is 60Hz then it takes 16.666... milliseconds (or 0.0166666... seconds) to wobble up and down (or down and up - remember it doesn't matter!)

The formula means that as frequency goes up, then the period (time for one cycle) gets shorter. So a note of 440Hz (an 'A') would have a period of 2.273ms. Up an octave to 880Hz, and the period is 1.136ms. Up another octave to 1760Hz and we have to move to microseconds for expressing the period: 568.2µs or 0.5682ms. This is quite a wobble, if you think about it - the waveform is going from positive to negative in just over half a thousandth of a second.

'Wobbles' is actually a very useful word for describing sine waves. That smooth shape is not an accident - it turns out that if you make a ruler twang, or watch a pendulum swing, or pluck a string, or turn an amp up so that you get feedback from a microphone, then the basic shape of the time wavform that you get is probably a sine wave (or similar). This is because objects in the real world are lazy - they expend as little effort (energy) moving as possible, and the way of something moving back and forth (or up and down, or side-to-side) using the least energy is a sine wave. Look up 'Simple Harmonic Motion' if you want to read about maths and physics... It a bit like: 'the shortest distance between two points is a straight line' - it's one of those fundamental things about how the universe works. 

If you want, you can do a totally non-scientific experiment that kind of illustrates this 'least energy' thing. Hold out your arm, with your hand vertical. Now wave it from side to side smoothly counting 'one thousand, two thousand, three thousand...' so that you are doing one cycle every second (a frequency of one cycle per second is 1 Hertz (Hz), and has a period of 1 second!). Then try jerking your hand as quickly as you can between two stationary positions about 100mm apart at the same rate. Instead of a smooth, continuous waving movement, it should be just two brief movements interspersed with waiting. You should find that it feels like you are using much more energy to do the 'Square-shaped' wave than the smooth 'Sine' wave.

So the sine wave is interesting and important because it is least energy and a very smooth shape, and it turns out that it is pretty fundamental in other ways too - you can make any waveshape by adding together sine waves of different frequencies, amplitudes and phases. Phase is just the relationship between two waveforms. If they are 'in phase' (no phase difference) then they go up and down at the same time... Let's look at some diagrams:


Zero crossings are one of the standard places on the waveform that are used to determine phase differences. In the diagram above, the blue circles highlight the zero crossing as the descending sine wave crosses the horizontal zero 'time' axis. From left to right, the two sine wave are: 'In phase', 'slightly out of phase', and 'Out of Phase'. The 'Out of Phase' can also be called 'Anti-phase' - here the two sine waves are opposite: as one goes up, the other goes down, and vice-versa. Phase is normally measured in degrees, as if the time axis was wrapped around a circle. So 'In Phase' is a phase difference of 0 degrees, whilst 'Out of Phase' or 'Anti-Phase' would be 180 degrees. If you keep increasing the phase difference, then eventually you go around and end up at 359 degrees, then 0 degrees as the two waves are in phase again.   


The diagram above uses the highest positive peak of the sine wave, which is often easier to see on some waveforms. Again, the three examples are: 'In phase', 'slightly out of phase', and 'Out of Phase'. Phase difference can be measured with any waveform - sine waves are just used here as examples. Waveforms that have lots of similar height peaks, or lots of zero crossings, can be difficult to try and figure out by viewing the waveforms. There are electronic meters which can measure phase in audio signals, and these are used in filter design, loudspeaker crossover design, phase pedal effects, and more. There are filters called 'all phase filters' that only change the phase of signals that pass through them, and a phase meter is used to characterise them.    

Earlier, I noted that it was possible to make any waveform by adding together sine waves of different frequencies - well, there's an exception to this... The only wave that can't be made by adding together two or more sine waves is... a sine wave. A sine wave has only one frequency 'inside' it, which is why it sounds so 'pure' when you listen to it, and also it is why it is so smooth in shape. If you added any other sine waves then the shape would be less smooth. Circles and sine waves are the ultimate in smooth!

When you turn down the cutoff of a low-pass filter, then you can hear high frequencies being removed from the signal, and eventually, there is only the sine wave left. So the lowest frequency you hear is the frequency of the sine wave itself, and if you turn the filter cutoff down even lower, then even that sine wave will vanish and you get silence. 

Combining and extracting multiple sine waves will be examined in more detail in a future part of this series.

The Waveform - Deeper

Wrapping the time axis around so that it forms a circle is actually a clue to what the 'single cycle' diagram really is - a convenient abstraction that turns reality into something easy to visualise. Actually, a waveform is always moving up and down in time, and the waveform view just captures that up and down movement and makes it visible. If the sine wave is a sound, then the waveform shows how the air is compressed and rarified (not a word we use very much!). If the sine wave is a voltage, then it shows the change of voltage as the sine wave moves up and down. So a waveform is like a long exposure photograph that freezes movement. (or a stroboscope that uses a flashing light to 'freeze' movement...)

Let's dig deeper into a waveform:


The first thing that often surprises people is that the waveform continues both backwards and forwards in time. The waveform repeats over and over again. each time the same. (If the waveform changed over time, then there would not be a single waveform that we could use to represent it.) This means that the start of the waveform (let's start at the first zero crossing) is also the end - remember the wrapping round of the time axis into a circle. This means that the level at the start has to be the same as the end - but it does not mean that the slope of the line at the start has to be the same as at the end. 


Above is an example where the level is the same at the start and the end, but the slope is different. In earlier versions of this blog post I said that the slope had to be the same, and this diagram shows that this is not correct. However...


In the diagram above I have moved the discontinuity so that it is more central, and the start and end are now on the zero axis. The slopes at the start and the end are now the same! 

It turns out that there is a convention to drawing waveforms that makes them easy to understand. One of the rules in this convention is that you don't have a discontinuity at the start - because it hides the shape of the waveform!


The diagram above shows a triangle waveform displayed in two different ways. One the left is a waveform drawn using the convention, and on the right is the same waveform, but with a discontinuity at the start. As you can see, the waveform on the left is easy to comprehend, whilst the one on the right is more difficult to comprehend. Basically, I'm so used to drawing waveforms that follow the convention that I made an assumption - which is not a good idea!

If there is a discontinuity (the technical word for a sharp change in the waveform) then this will create high frequencies in the spectrum. If you think about what a single sudden change would sound like, then it would be some sort of click. But if that click is caused by a discontinuity in the waveform then it will repeat for every cycle, as so generates lots of high frequencies.


One of the things that is often never explained by most sources is what you can and can't do with a waveform. The levels being the same at the start and the end is the first 'not immediately obvious' thing to note. But the diagram above shows some more.

The steepest slope is one that is almost vertical. It can't be completely vertical, because this would mean that there were several different values at the same time (the horizontal axis is time...), and this isn't usual in this reality. You might like to try thinking about a different universe in which an LFO could have several different values at the same time, and follow it up by Googling 'Schrodinger's Cat'. 

You can't have slopes that go over, because this would mean that the waveform was moving backwards in time. Equally, a waveform can't cross over itself, because this would mean that there were two values at the same time.

Finally, you can't have a gap in a waveform - there is always an amplitude value for each time. Now a digital waveform is actually just a series of sample values, but you can't have empty sample values either.  


One 'Ah, but...' FAQ at this point often revolves around sawtooth or square waves. They may appear to have gaps in them, but actually it is a very steep (nearly vertical) slope, followed by a much slower slope. On some screens, especially old oscilloscopes, the slow slope is all that is visible, but it doesn't mean there is a gap. In digital samples, a sawtooth can change from a big negative value to a big positive value with a single clock. Some text-book diagrams don't always show sawtooth waveforms as being continuous, and these are called 'idealised' (meaning 'not realistic'). For this post, I'm going to show waveforms in their realistic form, so they will be continuous.


Square waveforms are mostly flat (remember moving your hand from side to side in the experiment, earlier?), but they again have almost vertical slopes joining the two flat portions, and again they are sometimes shown in text-books as idealised pairs of flat output values with gaps between them.

Any time that there is a nearly vertical slope or a sharp corner (like on a square wave or a sawtooth wave), then this indicates that a high frequency is present in the audio (more about this in a future part). If you filter a square wave so that some of the higher frequencies are removed, then you get ripples on the top and bottom portions of the waveform...


These ripples are caused by there not being enough high frequencies to draw in the flat top and the almost vertical edge. In the diagram above, can you imagine what frequency sine wave would be required to cancel out the ripples in the top and bottom portions?

One useful diagnostic technique works well on waveforms which are approximately square. If you imagine a vertical axis in the middle of the flat portion, then if the waveform is 'mirrored' around this axis, then this means that the audio contains mostly odd multiples of the fundamental frequency. If you think about this, then a square wave is the perfect mirror around that mid-flat axis, and it turns out that a square wave does contain only odd multiples of the fundamental frequency. 

In physics (and most science) you are often given a theory or Law, and then told when and why it doesn't always apply. In the real world there are often 'ah, but's! So it turns out that the mirroring effect only works when the harmonics are all in-phase... So, phase can sometimes be very important. Let's investigate this:


The above diagram shows the effect of changing the phase of the sine wave that it 3x the fundamental sine wave frequency. 10 degrees (there are 360 degrees when you go all the way round a circle, so 10 degrees is a tiny amount) puts some wobble into the top of the waveform, so it isn't flat any longer. 30 degrees makes the ripple bigger. By the time we get to 60 degrees (cutting a pie into 6 equal pieces gives you six pieces each with a 60 degree angle) then the square wave is almost lost and mostly what we see is a jagged waveform that has a lot of a waveform that is 5x the fundamental sine wave frequency.

So for the shape of a waveform, phase matters. But if you listen to all of these waveforms, then they all sound like a square wave. More on this in a later blog post...


One final thing that you can see just by looking at the shape of a waveform is the 'DC offset'. All of the waveforms so far have been centered on the zero axis, so there's no overall voltage present all the time - the positive and negative bits just cancel out. But the diagram above shows that if the area above that horizontal zero axis line is different to the areas below, then you can get a DC offset. DC offsets can make clipping asymmetric, which changes the sound, and they can cause clicks if you connect a cable carrying an audio signal that has a DC offset. 

Just to come full circle, the above diagram also serves as a reminder about 'The 30 or 40dB Rule' - if there is part of the sound that is lower in level by more than about 40dB, then it will be too small to be visible in a waveform. I am pretty sure that this aspect would probably get breathlessly emphasised in some YouTube videos!

Single Cycles

You should now know more about single cycle waveforms, what they are, how they work, and some of the terminology around them. You also now know that the shape of the waveform is related to the timbre (or sound), and that the shape can be produced by adding together different frequency sine waves - although it seems that phase complicates this. But essentially, a single cycle waveform is a little fragment of timbre - actually, it is the smallest fragment you can have that gives a specific sound. 

Single cycle waveforms were used in early analogue oscillators, and were chosen to provide a diverse set of timbres. Sine waves for simplicity and 'purity' of tone. Square waves because they sound hollow. Sawtooth waves because they sound sharp and bright. And Pulse waves because they sound thin and buzzy. All of these are fixed 'snapshots' of timbre - they don't change over time.

Over time, oscillators were extended to provide additional waveforms - and significantly, these can change over time: Pulse Width Modulation changes the shape of a pulse wave so that it sounds 'animated' or 'chorussed'. Oscillator sync resets one oscillator waveform using another, and so generates a distinctive, glitchy sound. 

Using wavetables instead of fixed singe cycle waveforms allows the timbre to be changed over time: either smoothly by interpolating from one waveform to the next, or simply jumping abruptly from one to the next, which can give a fascinating 'glassy' texture. The ultimate smooth and long wavetable is a sample, of course, with a long looped sustain and a long looped release. 

So there's a basic split between the single cycle, 'fixed' waveforms, and the multi-cycle, 'timbre changes with time' waveshapes (made from wavetables or samples). Of course, the ultimate 'timbre changes over time' is noise, where it is randomly different every time. 

There's a simple model for sound synthesis that has Controllers controlling sound Sources like oscillators whose outputs are then altered in timbre and volume by Modifiers to produce the final sound output. When the output of an oscillator can change timbre over time then it stops being a pure 'Source' of sound of acquires some of the functionality of a Modifier, but then models are only supposed to be approximations of reality.


The table above fills in some of the possible sound Sources and sound Modifiers. One common application of the Source and Modifier model is for subtractive synthesis:


The above diagram shows how the oscillators and noise are treated as Sources, but it also has PWM (Pulse Width Modulation), Oscillator Sync, and FM as sources. The mixer is also interesting - does changing the mix between Sources count as a Modifier?


The diagram above extends the 'Modifiers' section so that it includes PWM, Sync and FM. This effectively leaves the oscillators with only fixed single cycle waveforms as Sources, plus noise.


Here's a table which emphasises that the only non-Modifier sound Sources that don't 'change timbre over time' are single cycle oscillators and noise generators. 

Simple oscillators with just a few single cycle waveforms (plus noise generators) are the main source of sound in synthesizers, but so far the only waveshapes that have been mentioned here are sine, square, sawtooth and pulse. This might appear to be a major limitation, and so the only area worth looking at might seems to be the Modifiers... But it turns out that this is not the case at all, and the next blog post will examine what you can do to exploit the possibilities of single cycle waveforms as much as possible. 

Analogue and Digital

I'm adding a quick note here because I didn't explicitly state that everything above applies to both analogue and digital synthesizers. The '30dB Rule' probably applies more to 'old-school' analogue oscilloscopes where the bright lines are a bit fuzzy, whilst the revised '40dB Rule' is more applicable to modern LCD displays which have less fuzziness. 

Links

Pianobook videos (This one describes an ADSR envelope...)

Pianobook.co.uk (Free user-created samples (crowd-sourced samples?))

Schrodinger's Cat (A sideways route into quantum physics...)

---

If you find my writing helpful, informative or entertaining, then please consider visiting this link:


Synthesizerwriter's StoreSynthesizerwriter's Store
 (New 'Modular thinking' designs now available!)


Monday 19 October 2020

The 30 dB Rule Revisited - [Single Cycle part 1]

Technology changes all the time, sometimes for the better. One of the background tasks that tends to get forgotten is to revisit and re-assess old assumptions, and to update them when necessary. The mains electricity wiring in a house is one example - the insulation in cables does not last forever, and rubber, PVC and plastics all degrade over time. Recently, I have been blowing the dust off some of my archives of audio samples, and it reminded me of one of the first articles that I wrote for Sound On Sound magazine... It is still available on the Interweb:

SOS - The 30dB Rule   

It set me thinking: how has time changed this 'rule of thumb' that says that if you look at a waveform, you can only see the 'top' 30dB of whatever is in it? I was curious to see if advances in technology meant that this needed a revision...

Into the past...

May 1986 is over 35 years ago, and a lot of the things that you now probably use everyday didn't exist in anything like their current form: the World Wide Web, the Internet, HTML, cheap domestic microwave ovens, cheap laptop computers, LCD video monitors, mobile phones, MP3, DAT, DVDs, DAWs... and high streets full of little more than charity shops and coffee shops. 

Digital audio was possible, in a limited way, on a hobbyist computer. If you were in the know, then researchers in places like George Lucas's Sprocket Systems were working on prototype DAW-like technology, and if you had lots of money, then New England Digital's Synclavier was shipping direct-to-disc recording of digital audio, or you could sample at 8-bit resolution on a Fairlight CMI Series II, whilst you saved up for the recently-released Series III with 16-bits! Most ordinary hi-tech musicians were limited to just using computers for simple audio file editing, or for another relatively new innovation: MIDI. 

So, my samples from this time were mostly 8-bit, sampled at 8, 16, or maybe even the insanely high rate of 32kHz! They were mostly kept on 3.5 inch floppy disks (From Sony, which were encased in plastic and so weren't actually 'floppy' at all...) or on a hard drive which would be a few hundred Megabytes in a case about twice the size of a modern hard drive with a few Terabytes. To look at the files, CRT (Cathode Ray Tube) monitors would be used - VGA resolution (640x480) monochrome LCDs didn't appear until 1988, and colour LCDs didn't become affordable until the 1990s. You might like to create a graphic image sized 640 x 480 pixels on your current computer to see just how small it really is - on my 27 inch 5K (5120 x 2880 pixels) monitor it covers about the same area as a credit card.

So here's an 8bit sine wave, displayed more or less 1:1, so there are 256 pixels from the highest to lowest peak (except it isn't - no matter what I do, my browsers won't show the graphic actual size. Strange...). Anyway, just imagine that the following graphic image is 256 pixels in height: 


Now on a VGA monitor, that 256 pixel high sine wave is going to be taking up just over half of the screen height, so it is going to be pretty large. If you looked at the same sine wave on an Oscilloscope (You can still get them, although now they are digital, have LCD screens, don't get hot, and weight very little!) then you would probably set the controls so that it occupied about the same sort of percentage of the screen height - especially since 'scopes often have all sports of readout on the screen for frequency, voltage, range, offset... Notice that despite the 8-bits and the small image, it looks like a sine wave!

To 2020...

If we now do this with 16 bits and a bigger screen, then we can fast forward to 2020. We can take the normalised output as our maximum output level (let's call it 0dB), then we can compare it with a higher frequency (4x freq) sine wave attenuated by 30dB (i.e at -30dB). Because these are going to show relative levels, I'm not going to align the bits to pixels here, especially because I can't show 16 bits on a sensibly-sized screen (the screen would have to be 65,536 pixels high, which is more than 20x the vertical resolution of my current screen (2880 pixels).

So, from left to right, we have the sine wave at 0dB, a 4x frequency sine wave at -30 dB, and the result of mixing them together. The waveform on the right looks distorted, and is obviously not a sine wave, and if you listen to it, then it is very easy to hear the 4x frequency sine wave because it is only 30dB down, and your ears are good over a much bigger dynamic range than that. 

But the middle screenshot is particularly interesting. A signal 30dB down is just about visible on modern screens, but you can imagine that if this was an oscilloscope with a slightly fuzzy line of light as the display, then it might be possible to see the sine wave. But many 2020 synthesizers feature waveforms shown on small OLED displays that are not even 256 pixels high, and so the vertical resolution is worse than a VGA monitor, and worse than the 8-bit example shown above.

So let's try the same process at -40dB.

As before, from left to right we have the sine wave at 0dB, then the 4x frequency sine wave at -40dB, and then the result of mixing them together. The middle screenshot is now much smaller, and the sine wave on the right looks like...a sine wave. If you listen to it, then you can hear the 4x sine wave. but it is not obvious from looking at the screenshot that the sine wave is impure at all.

Finally, how about adding noise instead?


This time the middle screenshot is noise at -40dB. The right screenshot is the result of mixing the sine wave and the noise. It looks pretty much like a sine wave to my eyes, although when you listen to it, you can hear the added noise (it is only 40dB down). On an oscilloscope, the width of the line is going to hide the noise even more effectively.

Let's simulate that:


So anything smaller - like below -40dB - is not going to be visible to your eyes at all...

The 40dB Rule...

Over 30 years of progress has given us better displays, and cheaper, lighter oscilloscopes. But it seems that just 'looking' at waveforms still only tells you about the top 40dB or so of the signal. Anything lower than that is not going to be visible. 

"You can only see the top 40dB or so of a waveform..."

and a useful pair of corollaries:

"Your ears are much better at hearing than your eyes. Don't trust waveforms."

"On a small OLED screen, you may only see the top 30dB of a waveform, or less."

At one time, it was quite popular for synthesizer manufacturers to provide the ability to draw waveforms (usually using light pens, but these days you would probably do it with a mouse)... Hopefully, you now know why this is not a good idea if you want to have control over anything other than the very loudest component parts of the sound.

Only today, I saw a Facebook post where a person was describing how an analogue synthesizer software emulation VST had been prepared with great care, emphasising that the actual and emulated waveforms had been compared on an oscilloscope 'very carefully'. Unfortunately, you now also know that this is not a good technique to base comparisons on. Instead, spectrum analysis of the waveform would show the frequencies that were present down to levels much, much lower than -40dB!  

---

If you find my writing helpful, informative or entertaining, then please consider visiting this link:


Synthesizerwriter's StoreSynthesizerwriter's Store
 (New 'Modular thinking' designs now available!)